Solar Panel Payback Calculator for Greater Manchester
Key takeaways
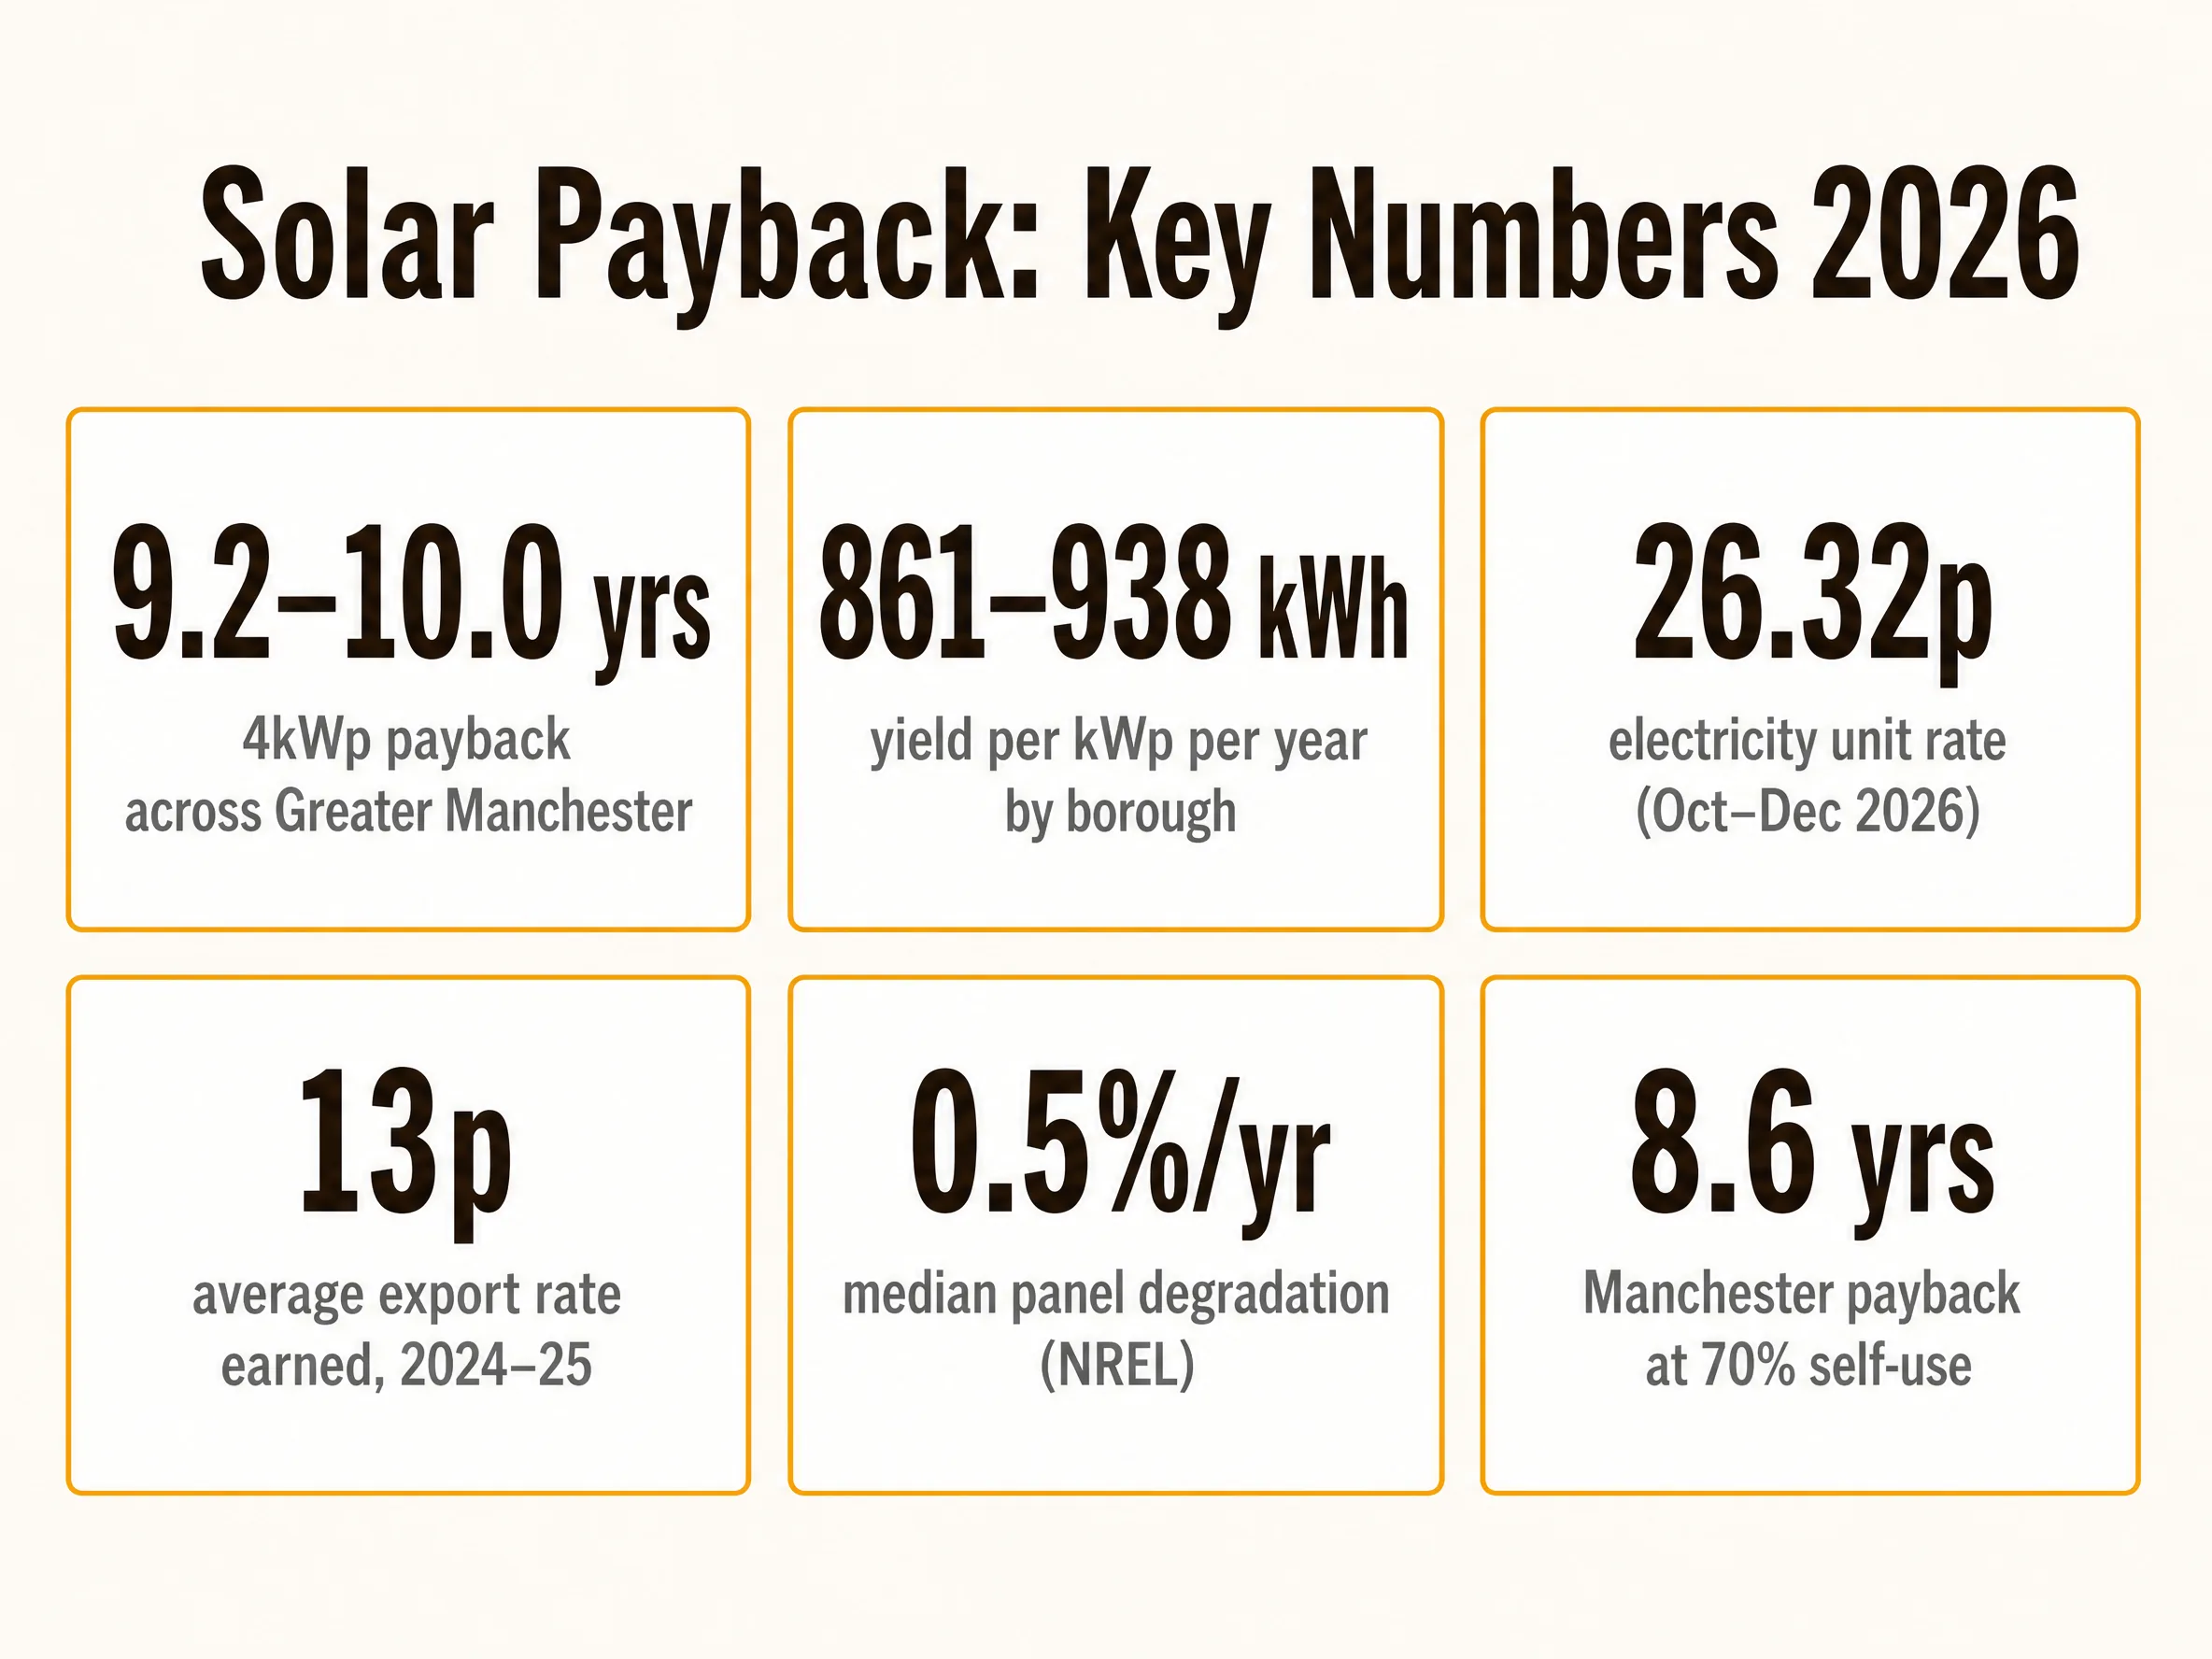
- A 4kWp system pays back in 9.2 years in Wigan and Warrington and 10.0 years in Oldham, Rochdale and Tameside on the same assumptions (PVGIS yields).
- Yield ranges from 861 kWh per kWp a year in Tameside to 938 in Warrington, about a 9% spread across Greater Manchester.
- Using more of your own electricity matters most: raising self-use from 50% to 70% cuts a Manchester payback from 9.7 to 8.6 years.
- Export rate matters when self-use is low: at 30% self-use, payback swings from 17.8 years on a 4.1p SEG tariff to 7.5 years on a 25p fixed deal.
- Panels lose output slowly: NREL’s review found a median degradation rate of about 0.5% a year.
- The calculator uses the Ofgem October–December 2026 unit rate of 26.32p/kWh by default.
How does the solar panel payback calculator work?
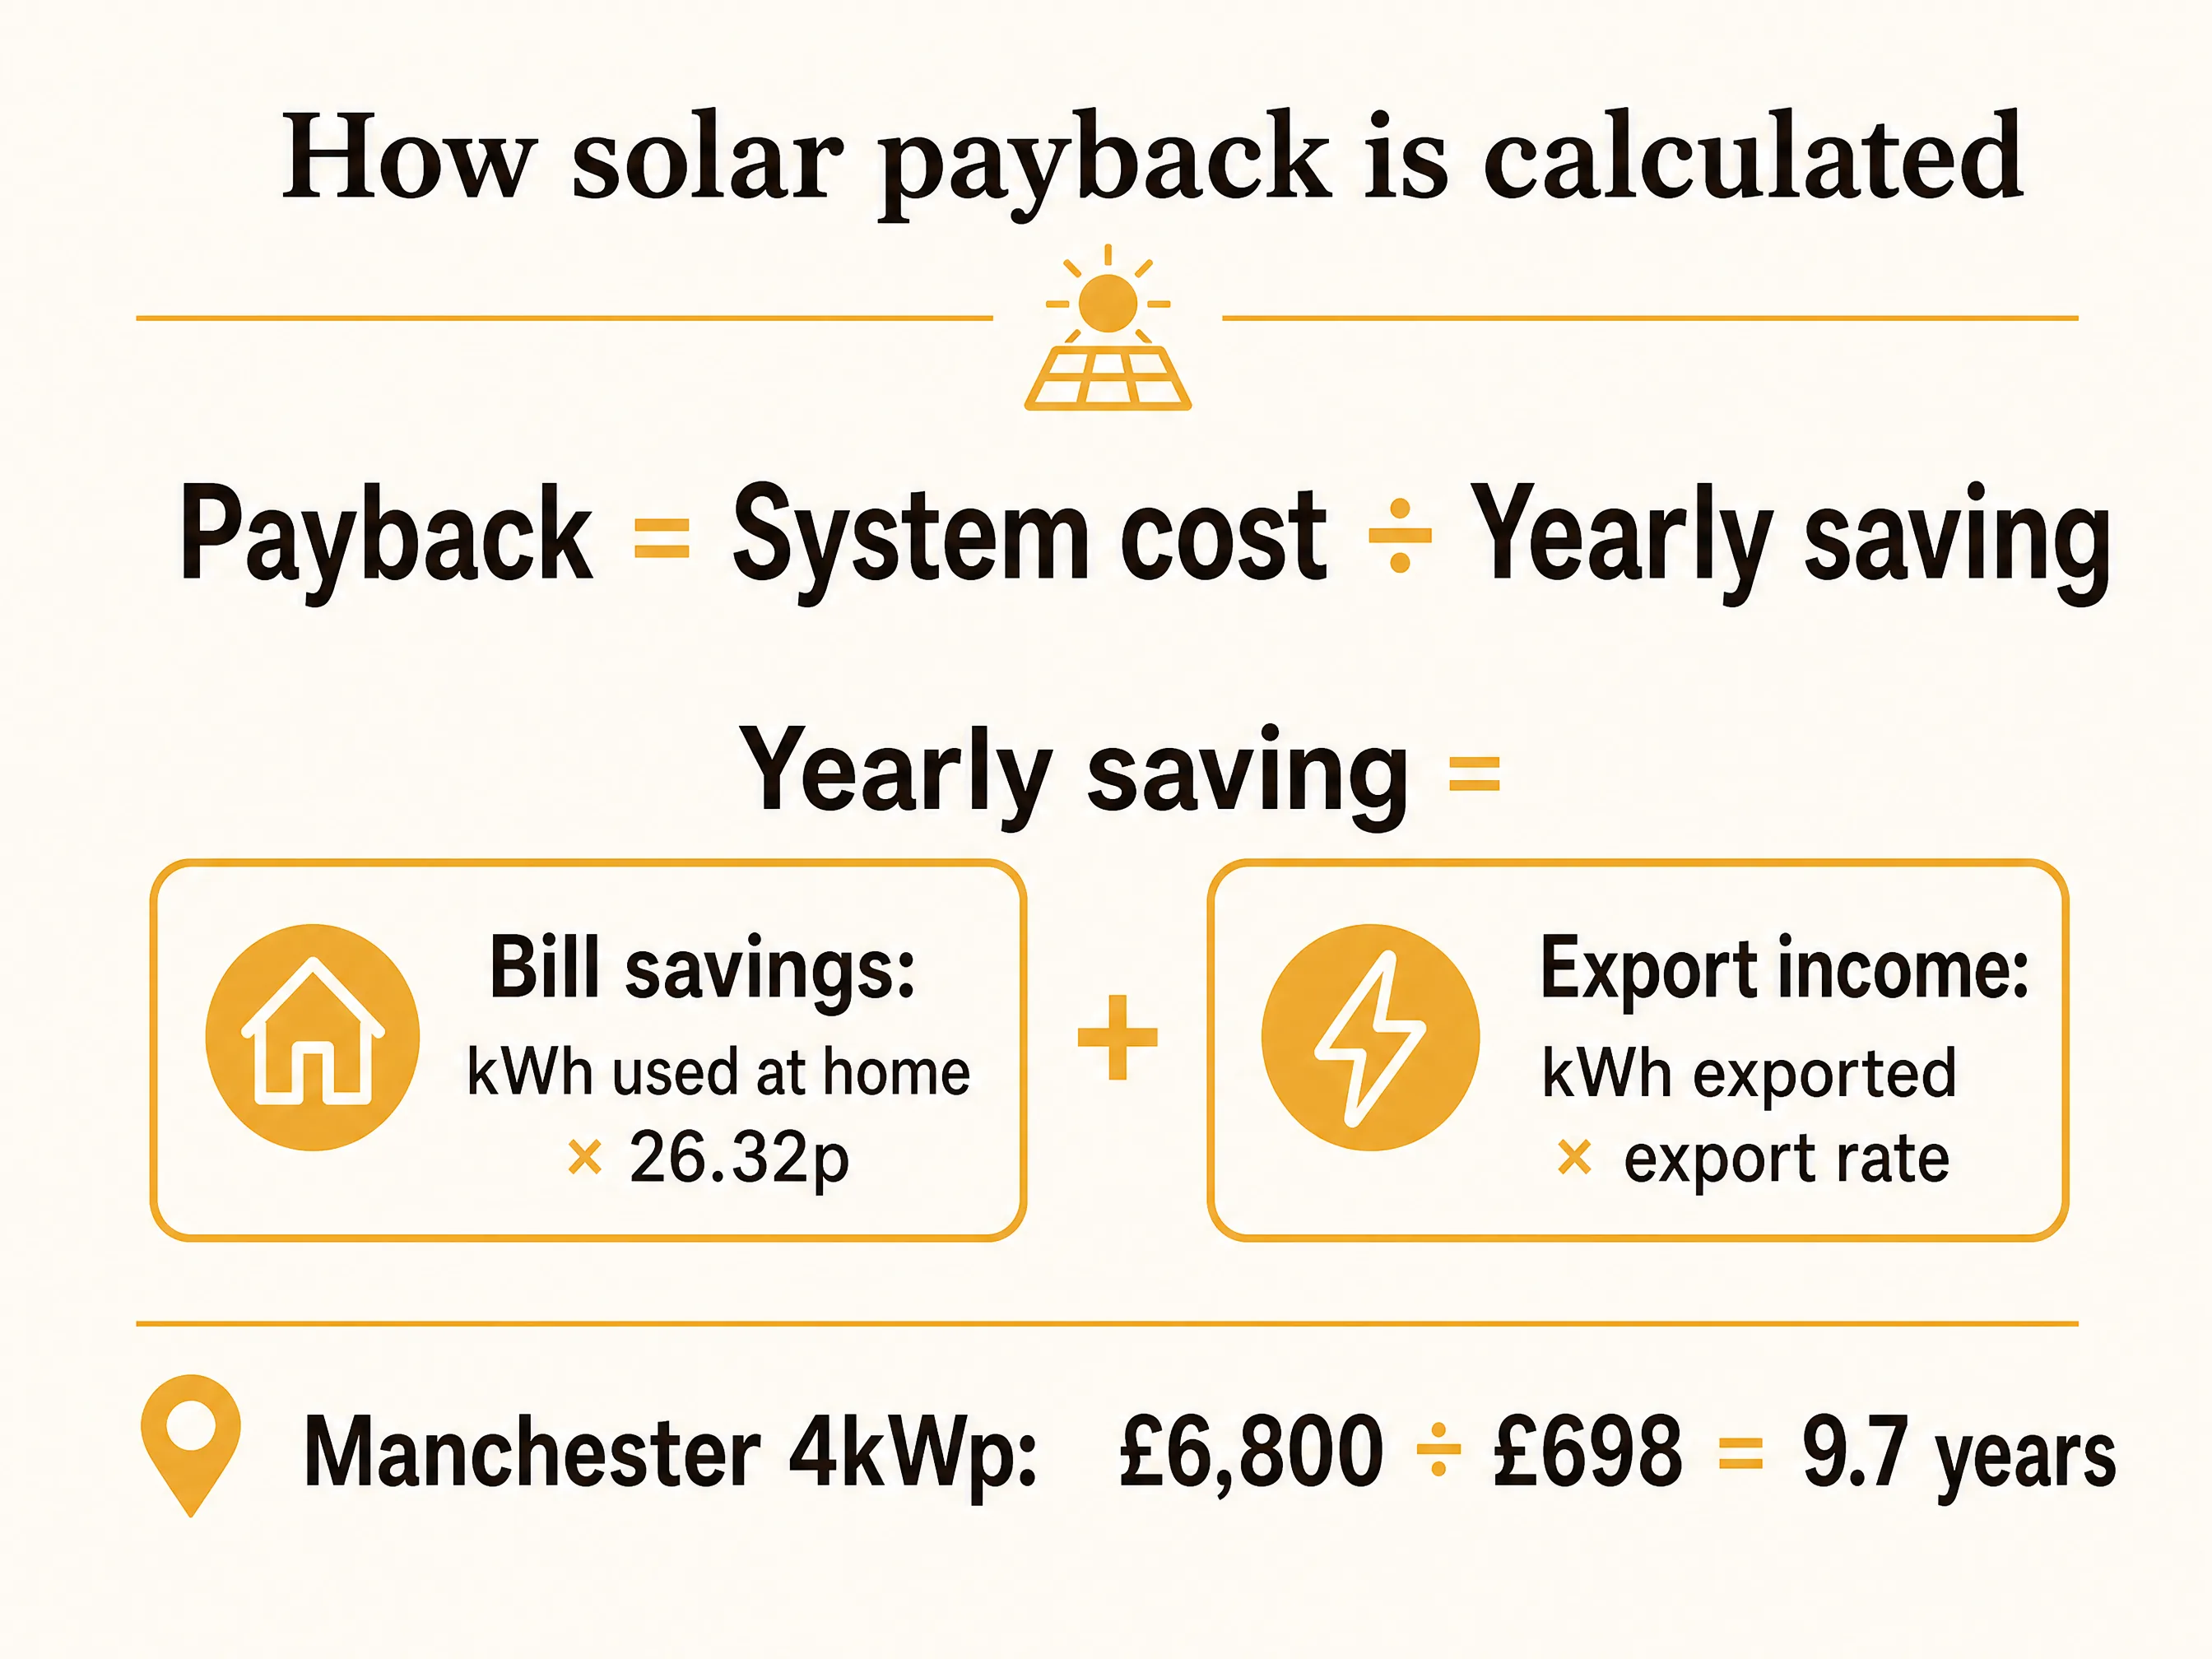
It divides the system cost by the yearly saving. Generation comes from PVGIS yield for your borough multiplied by your system size. The saving is the share you use at home multiplied by your unit rate, plus the share you export multiplied by your export rate.
Defaults are 4kWp at £1,700 per kWp, 50% self-use, 26.32p/kWh and 13p/kWh export. Change any of them to match your quote and tariff.
System size (kWp)
Annual generation
3,552 kWh
Payback
9.7 yrs
Uses Manchester's PVGIS yield of 888 kWh per kWp a year.
What is the solar payback period in each Greater Manchester borough?
On identical assumptions, the western boroughs pay back fastest because they get more sun:
| Borough | Yield (kWh/kWp/yr) | Yearly saving | Payback |
|---|---|---|---|
| Warrington | 938 | £738 | 9.2 years |
| Wigan | 935 | £735 | 9.2 years |
| Trafford | 924 | £727 | 9.4 years |
| Bolton | 904 | £711 | 9.6 years |
| Salford | 897 | £705 | 9.6 years |
| Manchester | 888 | £698 | 9.7 years |
| Bury | 888 | £698 | 9.7 years |
| Stockport | 883 | £694 | 9.8 years |
| Oldham | 866 | £681 | 10.0 years |
| Rochdale | 865 | £680 | 10.0 years |
| Tameside | 861 | £677 | 10.0 years |
Open any borough for local grants and monthly output, for example solar panels in Warrington or solar panels in Tameside. Or compare them all on the Greater Manchester hub.
Which inputs change solar payback the most?
Self-use and export rate, far more than location. For a £6,800 4kWp system in Manchester:
| Self-use | 4.1p export | 13p export | 25p export |
|---|---|---|---|
| 30% | 17.8 | 11.3 | 7.5 |
| 50% | 12.6 | 9.7 | 7.5 |
| 70% | 9.7 | 8.6 | 7.4 |
If you're out all day, a good export tariff matters most. If you're home, using power as it's made is what counts. The best rates are compared in our Octopus vs local installer guide.
Does the payback calculator include panel degradation?
No, it assumes steady output, so treat the result as slightly optimistic. NREL’s analytical review of field data found a median degradation rate of about 0.5% a year, which adds a few months to a 10-year payback.
It also ignores future price changes. If electricity prices rise, payback shortens; if they fall, it lengthens. Re-run the numbers when the price cap changes each quarter.
How can you shorten your solar payback?
Cut the upfront cost and use more of the power yourself. Get a quote at or below the MCS benchmark price, check for funding in our grants guide, and run appliances in daylight.
A home battery raises self-use but costs £5,500–£7,000 for 10kWh, so model it carefully. Renters and flat owners can compare a small plug-in solar kit instead. When you're ready, get a quote.
Happy with the numbers?
Get a real quote and put its price into the calculator.
Solar panel payback calculator: FAQs
How long do solar panels take to pay back in Greater Manchester?
About 9–10 years for a typical 4kWp system: from 9.2 years in Wigan and Warrington to 10.0 years in Oldham, Rochdale and Tameside on the same assumptions.
What self-use percentage should I enter?
Around 50% is typical without a battery if nobody is home in the day. Enter 60–70% if you're home or run appliances in daylight, and up to 80% with a battery.
What export rate should I use?
Use your actual tariff. The average household earned 13p/kWh in 2024–25; basic SEG tariffs can pay as little as 4.1p and the best fixed deals 25p.
Does the calculator include battery costs?
No. Add the battery price to the system cost and raise the self-use share to model a battery.
Why is payback longer in Oldham than Wigan?
Oldham sits against the Pennines and gets about 7% less solar yield (866 vs 935 kWh per kWp a year), so the same system saves less.
Does solar panel degradation affect payback?
Slightly. Panels lose about 0.5% of output a year on median NREL data, which adds a few months to a typical payback.